Examine your data
The Basic Analytics page has three tabs: Happening Now, Examine Your Data, and User Activity Exporter, each tailored to offer distinct advantages for administrators. This guide walks you through the Examine Your Data tab functionality, ensuring you're well-prepared to leverage site data for informed decision-making and achieving your business goals. Learn more about using the Happening Now tab. Learn more about using the User Activity Exporter tab.
This page can be integrated into your site and is accessed through the More navigation menu.
Please note that all existing analytics pages and reports are still available. This page is an addition to existing reports.
Examine your data
This page categorizes site data into seven unique tabs with different widgets.
User Overview, Event Activity, Partner Interaction, Community Participation, Learning Engagement, and Networking Activity.
The tabs and filters are at the top of the page, allowing you quickly find the topic you’re looking for based on the content, activity category, and timeframe.
For example, the Forum Views widget would be under Community Participation, while the Live Sessions widget would be under Event Activity. Each widget displays data in a line graph to help you understand your data over time. You can narrow that time frame even further with the Time Frame, Start Date, and End Date filters.
Widgets are expandable to see more details. Select a widget graph to examine a specific time frame. Or, for even more granularity, filter the time frame to a single day and explore the chart by the hour.
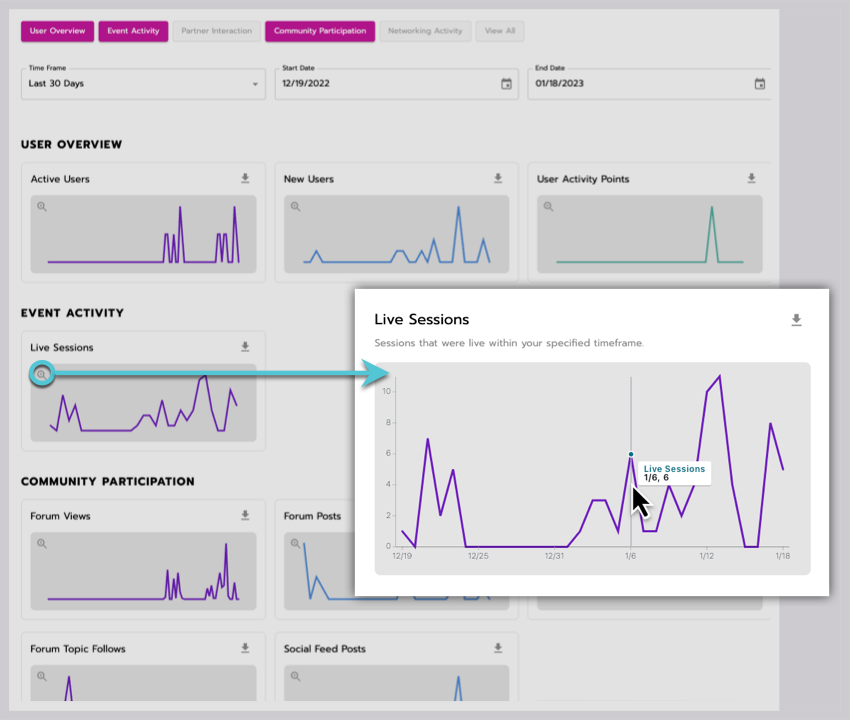
Examining the number of live sessions that occurred over the last 30 days.
Tab and Widget overview
At the top of each tab, you can refine your data using filters such as Time Frame, Start Date, and End Date.
For a breakdown of each widget and what to expect in their reports visit our Examine your data analytic's table page.
User overview
Active Users
Insights: Breakdown of Members' in-progress activities.
Downloadable report: Members' in-progress activities.
New Users
Insights: Breakdown of new member registrations.
Downloadable report: Details of new member registrations.
User Activity Points
Insights: Total points earned by users for various actions.
Downloadable report: Members activity points breakdown.
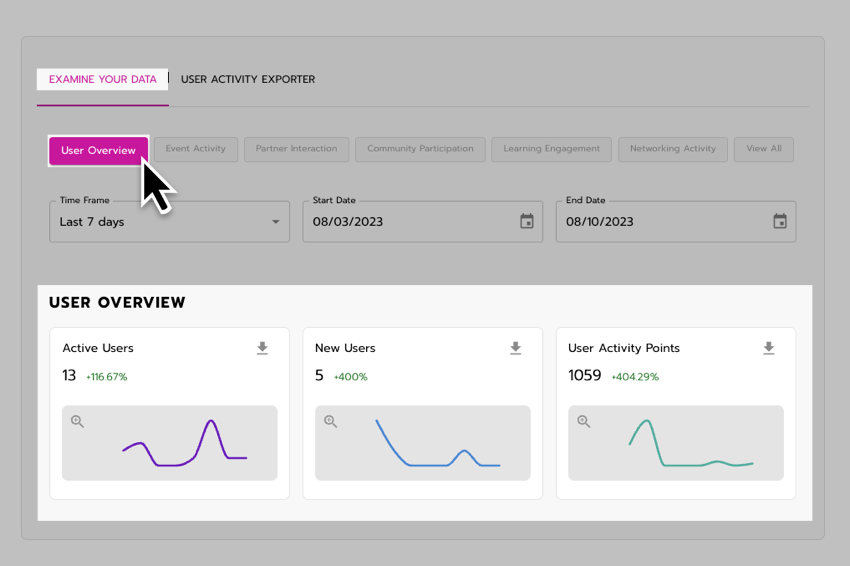
Examining the last seven days of User Overview data.
Event Activity
This widget provides insights into various live sessions, providing you with a breakdown by session type and allowing you to analyze event engagement and participation.
Live Sessions
Insights: Count of live sessions by session type.
Downloadable report: Details of each live session.
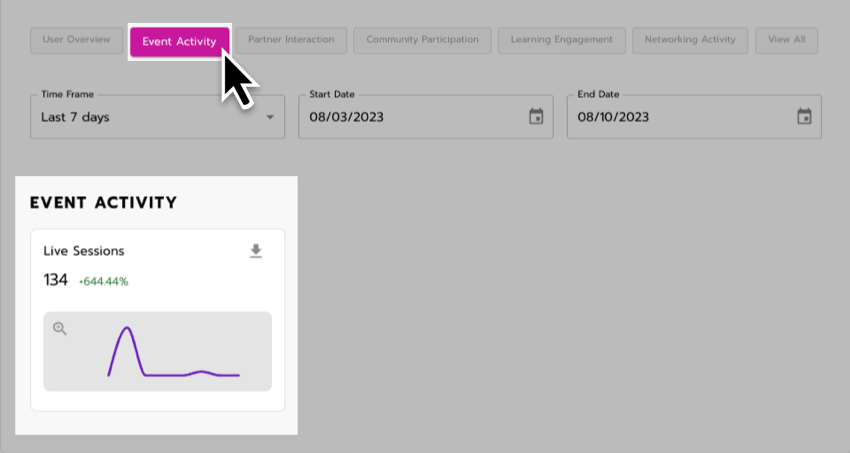
Examining the last seven days of Live Session data.
Partner Interaction
These widgets provide insights into partner engagement through scheduled meetings, page views, and initiated chats, allowing you to track and manage interactions with your partners effectively.
Partner Mtgs Scheduled
Insights: Total number of meetings scheduled by each partner.
Downloadable report: Members scheduled for each partner meeting.
Partner Page Views
Insights: Total views per partner page.
Downloadable report: Members' views for each partner page.
Partner Chats Initiated
Insights: Total number of chats initiated by each partner.
Downloadable report: Members involved in each chat initiated by the partner.
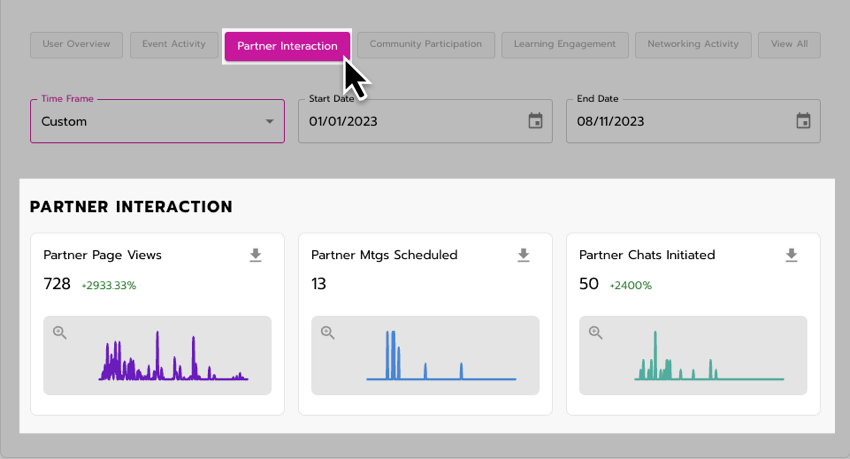
Examining a custom time frame of Partner Interactions.
Community Participation
These widgets provide insights into members’ engagement with forums, social feeds, and group pages. You can track their interactions, contributions, and interests within the community.
Forum Views
Insights: Total views by forum topic.
Downloadable report: Members who viewed each forum topic.
Forum Posts
Insights: Total posts by forum topic.
Downloadable report: Members who posted on each forum topic.
Forum Comments
Insights: Total comments by forum topic.
Downloadable report: Members who commented on each forum topic.
Forum Topic Follows
Insights: Total follows by forum topic.
Downloadable report: Members who followed each forum topic.
Social Feed Posts
Insights: Total posts by social feed.
Downloadable report: Members who posted on each feed.
Group Page Views
Insights: Total views by group page.
Downloadable report: Members who viewed each group page.
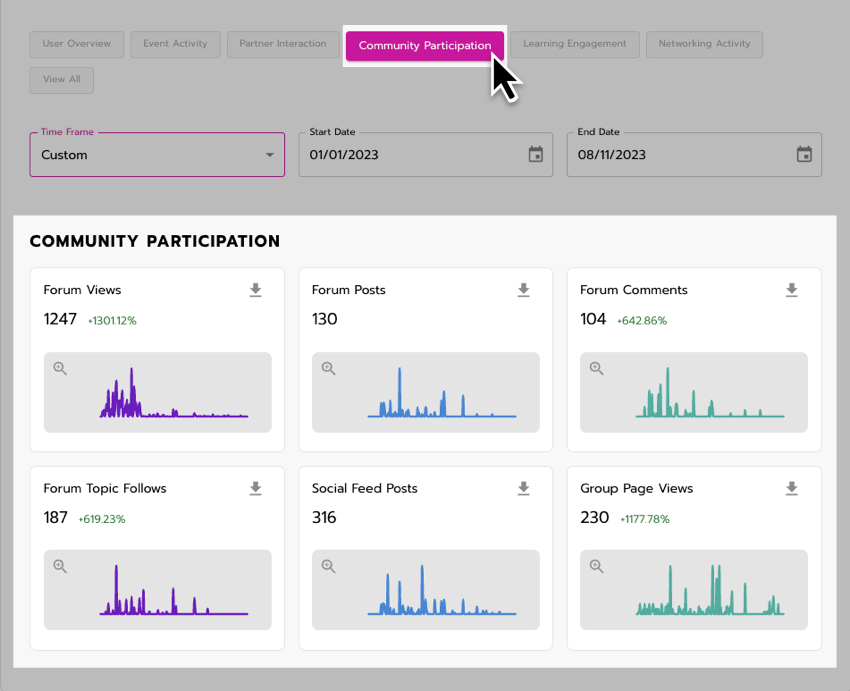
Examining a custom time frame of Community Participation.
Learning Engagement
These widgets provide insights into Learners' interactions with courses, on-demand content, certificates, and continuing education (CE) credits. You can track their course progress, engagement with content, and education credits.
Courses Started
Insights: Total number of started courses by course.
Downloadable report: Members who started each course.
Courses Completed
Insights: Total number of completed courses by course.
Downloadable report: Learners who completed each course.
Courses Enrolled
Insights: Total number of course enrollments by course.
Downloadable report: Learners who enrolled in each course.
On Demand/Library Views
Insights: Total views by content in on-demand/library.
Downloadable report: Members who viewed each content.
On Demand/Library Comments
Insights: Total comments by content in on-demand/library.
Downloadable report: Members who commented on each content.
CE Credits Earned
Insights: Total CE credits earned by credit.
Downloadable report: Learners who earned CE credits.
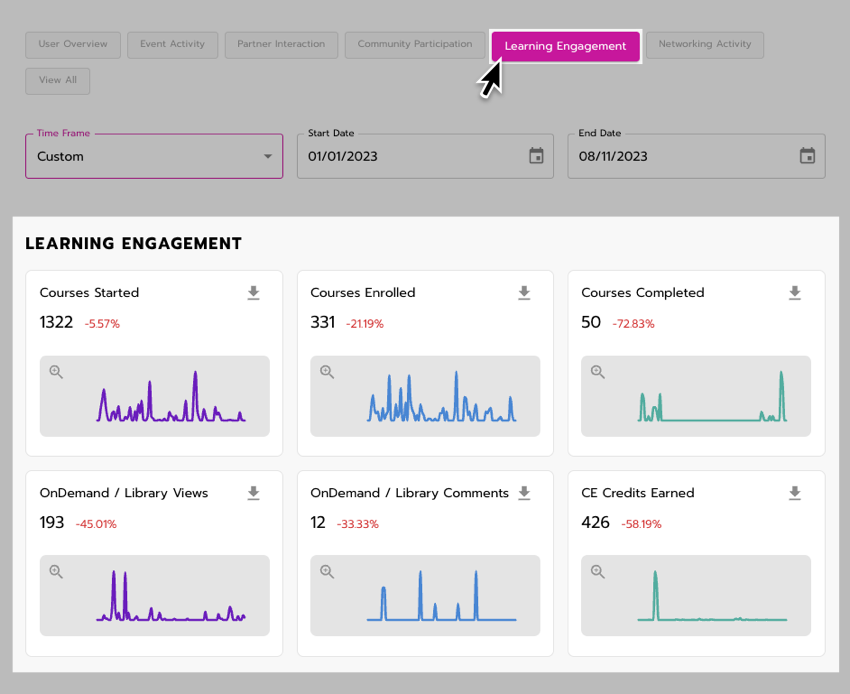
Examining a custom time frame for Learning Engagement.
Networking Activity
Each of these widgets provides insights related to networking activities, enabling you to analyze direct message conversations and 1:1 meeting scheduling by users.
1:1 DM Conversations
Insights: Each member’s total number of direct message (DM) conversations.
Downloadable report: Direct messaging invites initiated within your specified timeframe.
1:1 Mtgs Scheduled
Insights: Total number of 1:1 meetings scheduled by each user.
Downloadable report: (In Progress).
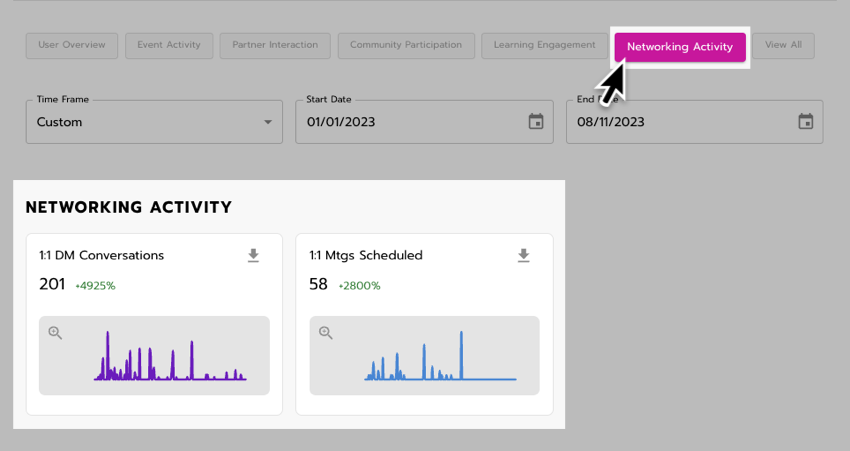
Examining a customer time frame of Network Activity.
